
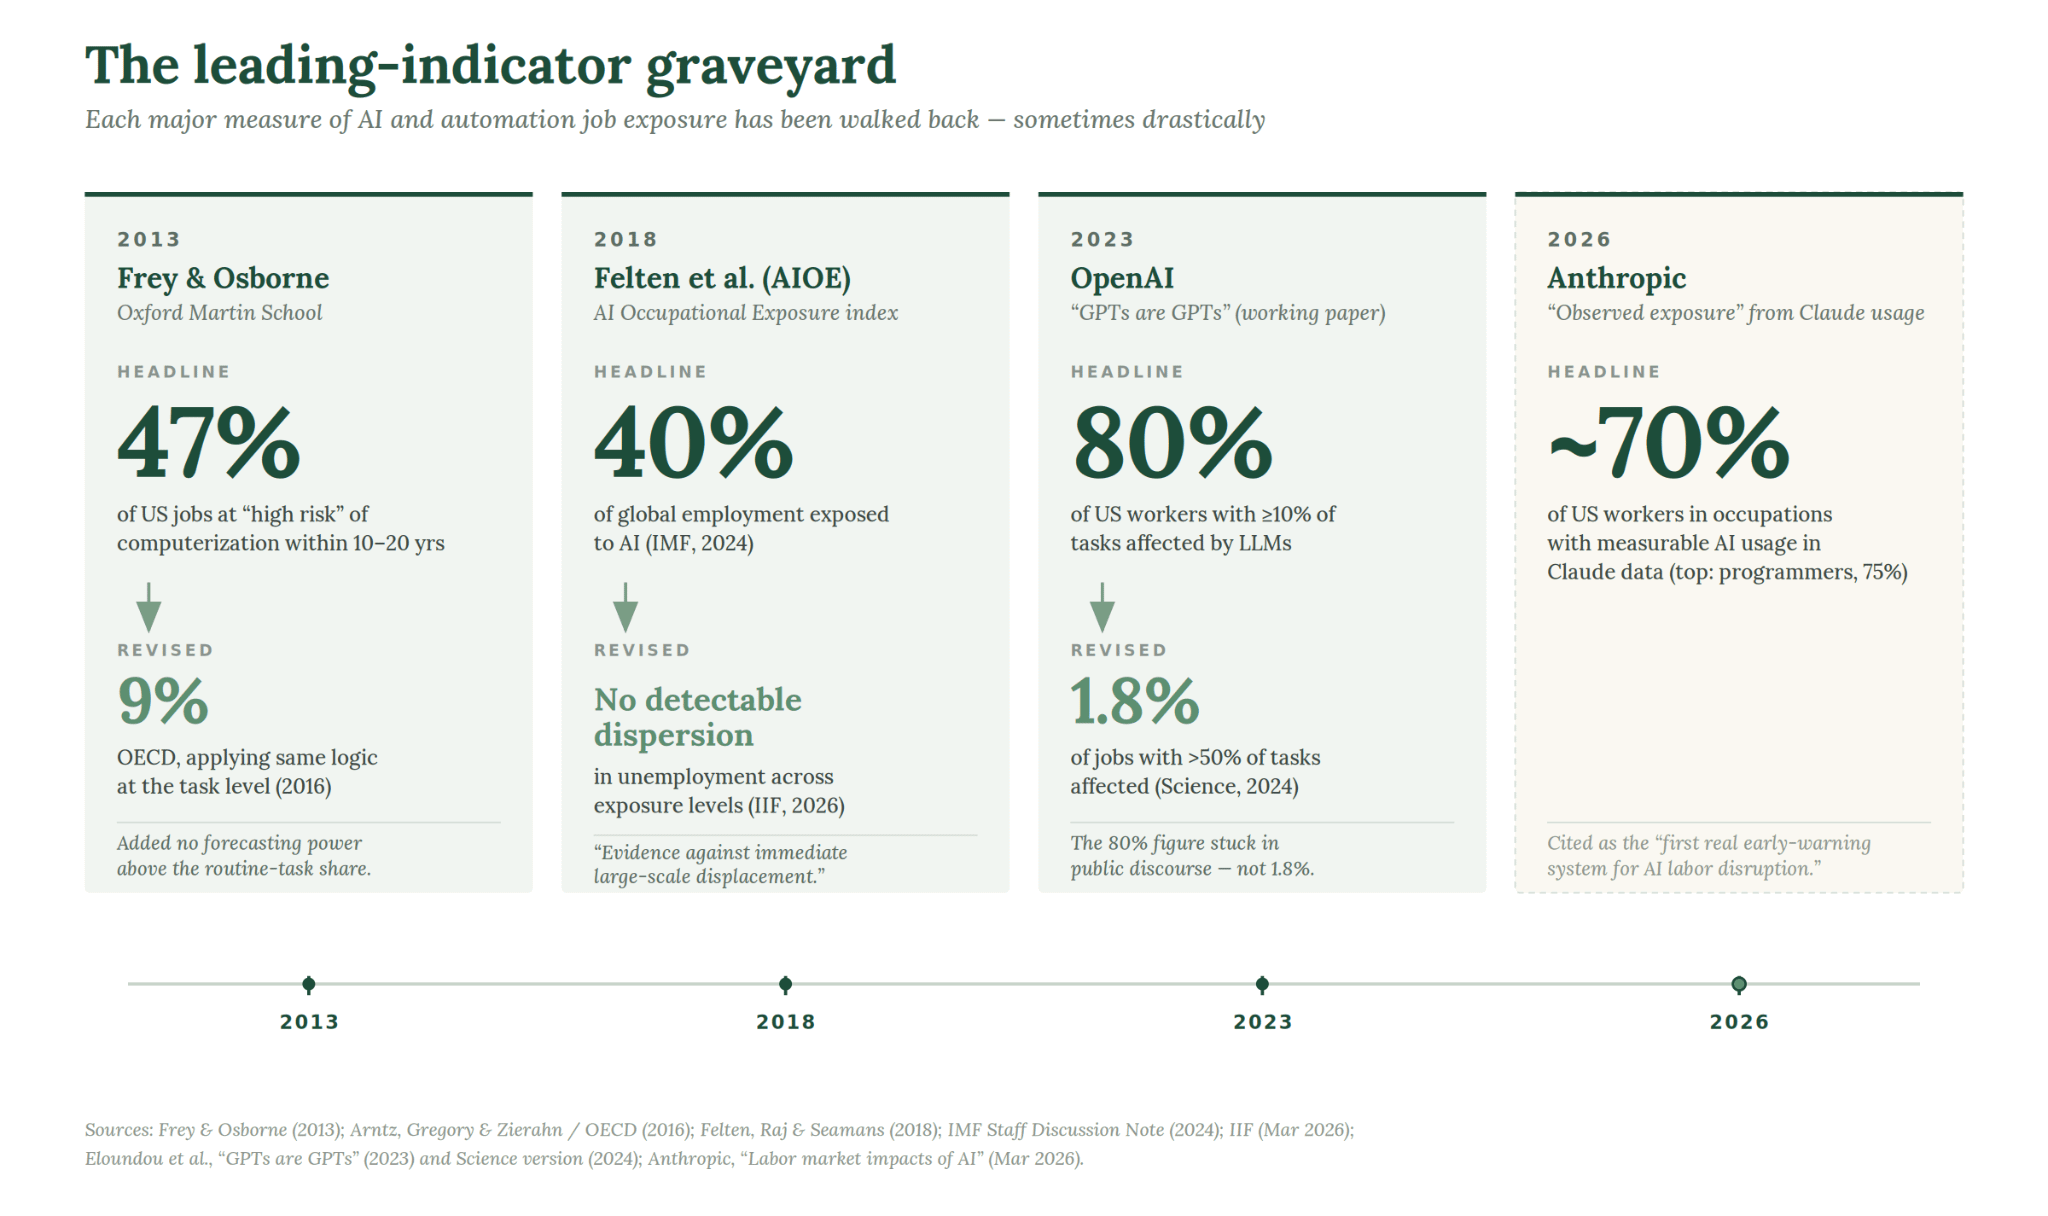
The leading indicator graveyard
Nobody knows what 'AI exposure' means


In 2013, Oxford researchers Carl Benedikt Frey and Michael Osborne published a paper estimating that 47% of American jobs were at high risk of being eliminated by computerization within the next decade or two. The number became a sensation. Obama’s Council of Economic Advisers, the Bank of England, and the World Bank all cited it, and it went on to shape a decade of retraining-program design and “future of work” discourse globally.
When OECD economists applied the same logic at the task level, recognizing that even workers in “automatable” occupations spend much of their time on tasks machines can’t do, the share of vulnerable jobs collapsed to 9%. When the original predictions were tested against US employment data, the methodology added no forecasting value beyond a simpler measure that was already in use: how much of a job consists of routine, rule-following work.
That arc of an attempted leading indicator for job displacement, a flurry of policy, and a walk-back has repeated every few years since. This isn’t shocking: it’s very hard to predict in advance which jobs will be automated away.
The latest in this lineage of prospective leading indicators is real-world data on AI usage from the labs themselves. In March, Anthropic published “Labor market impacts of AI: A new measure and early evidence,” introducing a metric called ‘observed exposure’ that combines Claude usage data with capability scores from OpenAI’s earlier work. The authors call it “a new measure of AI displacement risk.”
We finally have real data on AI and jobs, not speculative indices… right?
While the paper is carefully caveated, the trouble lies in the interpretation. Fortune covered the paper under the headline “A ‘Great Recession for white-collar workers’ is absolutely possible.” Yahoo Finance translated it as “Computer programmers, customer service representatives and data entry workers face the highest AI displacement risk today.” Industry analysts have rebranded the study with terms like “the first real early-warning system for AI labor disruption.”
Usage data is not useless, but what it measures — task-level AI deployment in professional settings — is several layers removed from labor substitution. These layers make the data poorly suited for answering the types of policy questions to which it is being applied.
The leading indicator graveyard
Frey and Osborne’s measure is the most famous iteration of this, but it’s not the only example. Since then, several more sophisticated methodologies have promised to fix its flaws.
In 2021, Edward Felten and coauthors introduced the AI Occupational Exposure index (AIOE), which mapped AI capabilities onto the abilities required across 800 occupations. AIOE inverted Frey-Osborne’s ranking, with high-skill cognitive work now most exposed. The IMF used it to argue in a widely cited 2024 staff note that 40% of global employment was exposed to AI. The IMF’s April 2025 “Global Impact of AI” paper fed AIOE scores into its macroeconomic forecasting models. AIOE measures theoretical overlap between AI capabilities and occupational abilities. An Institute of International Finance analysis from March 2026 combined it with granular employment data and found no dispersion in unemployment outcomes across exposure levels, which it noted was “evidence against immediate large-scale displacement.”
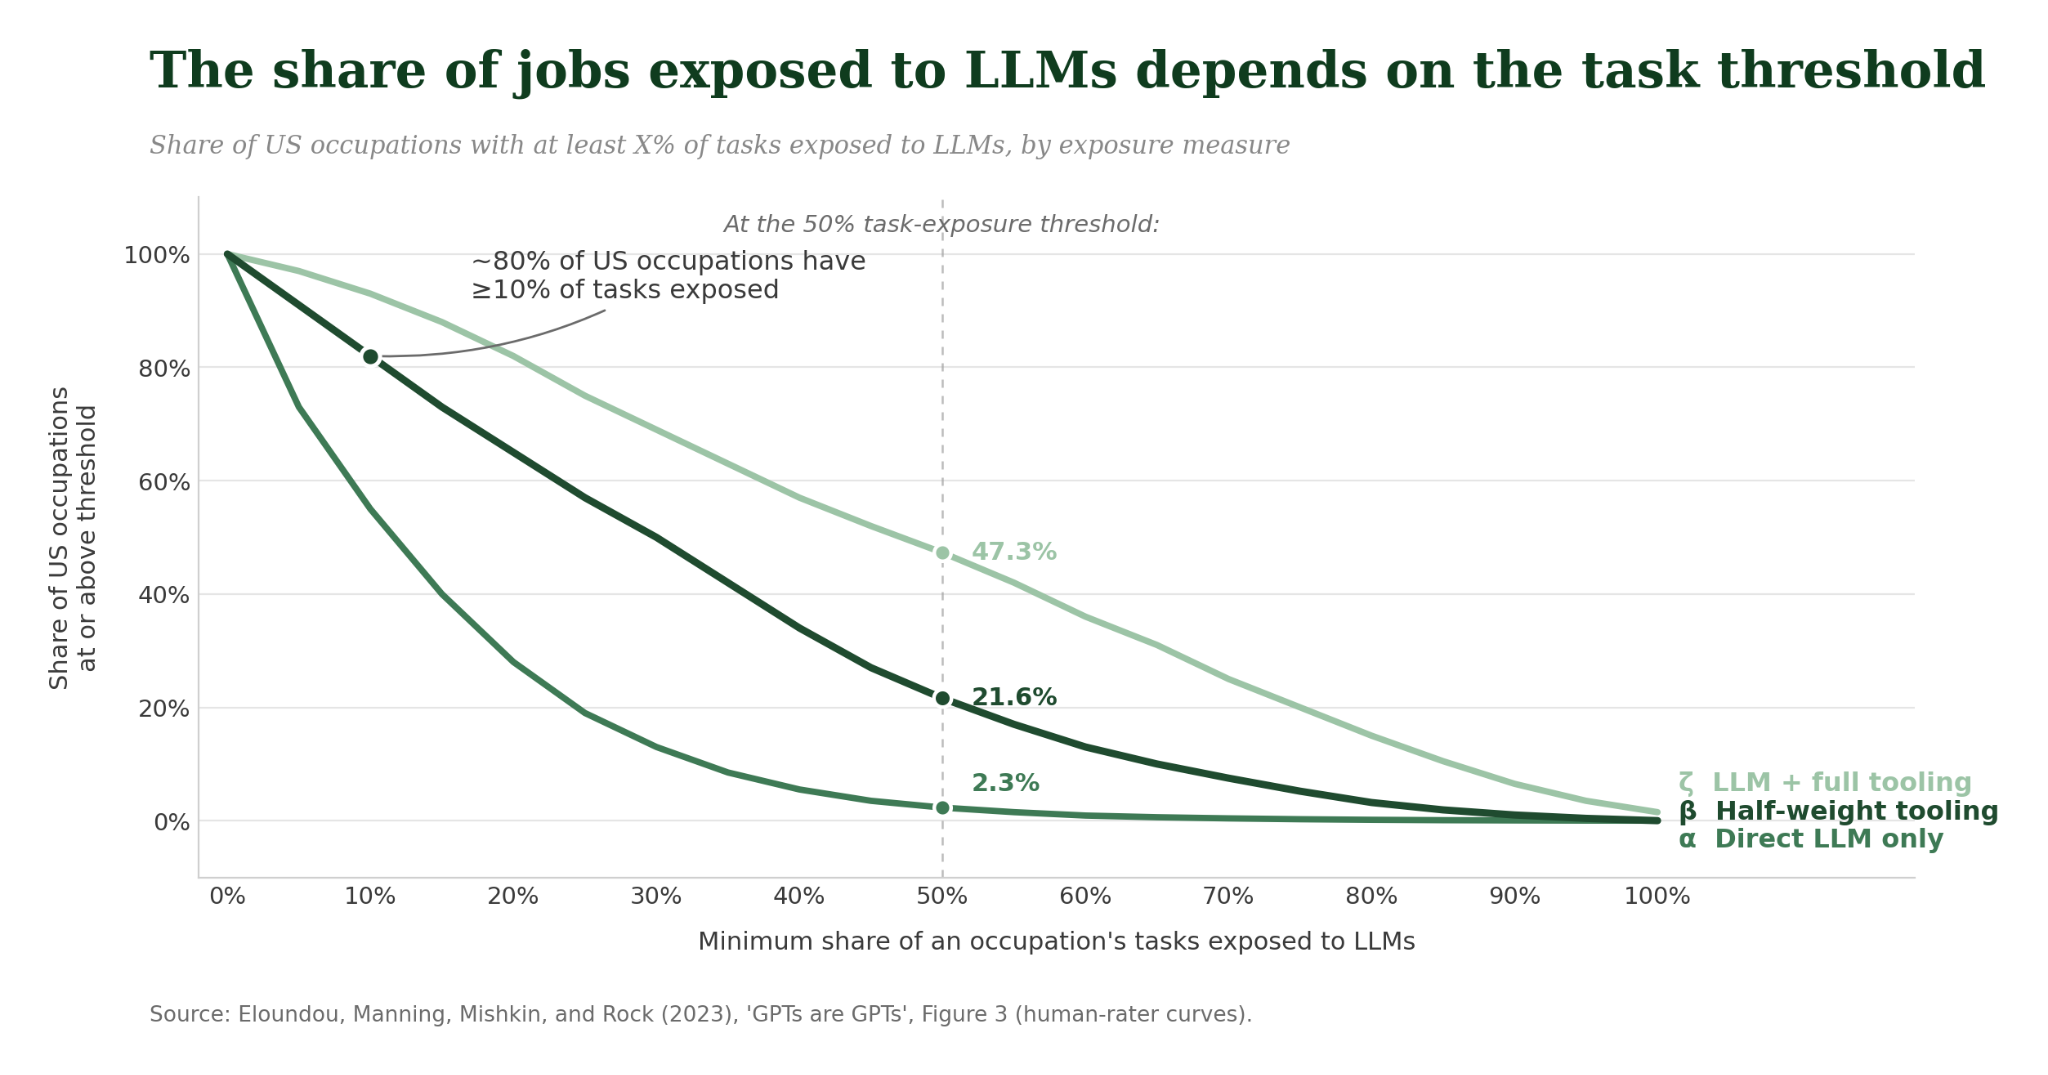
In 2023, OpenAI researchers published “GPTs are GPTs,” which used GPT-4 to score O*NET tasks for LLM exposure. The paper’s headline, that 80% of US workers might have at least 10% of their tasks affected by LLMs, became a canonical citation in policy discussions of AI and jobs through 2023 and 2024. When the authors published the work in Science in 2024, they showed how sensitive the results were to assumptions: only roughly 1.8% of jobs had over half of their tasks affected under a simple-interface assumption, but just over 46% did once current and likely future software complements were included. Predictably, the 80% figure is the one that stuck in public discourse.
Each measure, whether it be expert judgment, ability mapping, capability scoring, and now behavioral usage data, acts as a different upstream proxy for AI’s potential effect on work and is quickly cited downstream as evidence of exposure — which is often taken to mean displacement. The newer measures aren’t necessarily wrong in the same way Frey-Osborne turned out to be: AIOE may be measuring real capability-occupation overlap, and observed exposure is measuring real usage. The problem is that the thing they measure is several steps removed from the thing they’re cited as evidence for, and that gap doesn’t get smaller as the upstream signal gets more ‘real’.
Can yet another upstream proxy carry the weight of the policy decisions being built on top of it?
What is going on?
To understand why each new measure ends up in the same place, it helps to picture AI’s path to job loss as a chain with four links: capability, usage, workflow integration, substitution.
Capability is what models can theoretically do. This is measured by benchmarks.
Usage is what people actually do with them.
Workflow integration is how that usage gets embedded in how firms organize work.
Substitution is what most policy questions are really asking about — whether a worker, somewhere, lost a job because of AI.
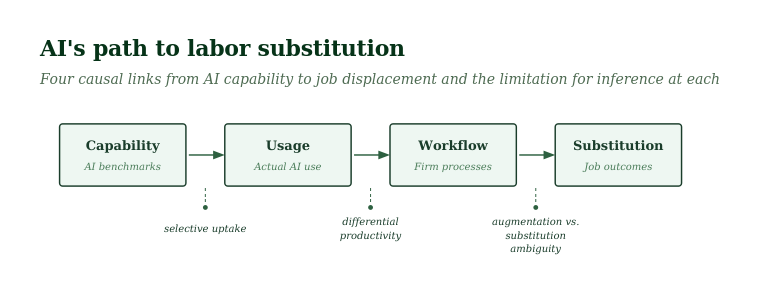
Each link carries information about the next, but the gaps between them are massive.
Usage is not productivity
A log entry showing Claude performed a particular task tells you the interaction happened, but it can’t tell you by how much it increased the worker’s output. In order for usage to translate to labor impacts, that usage has to produce something valuable.
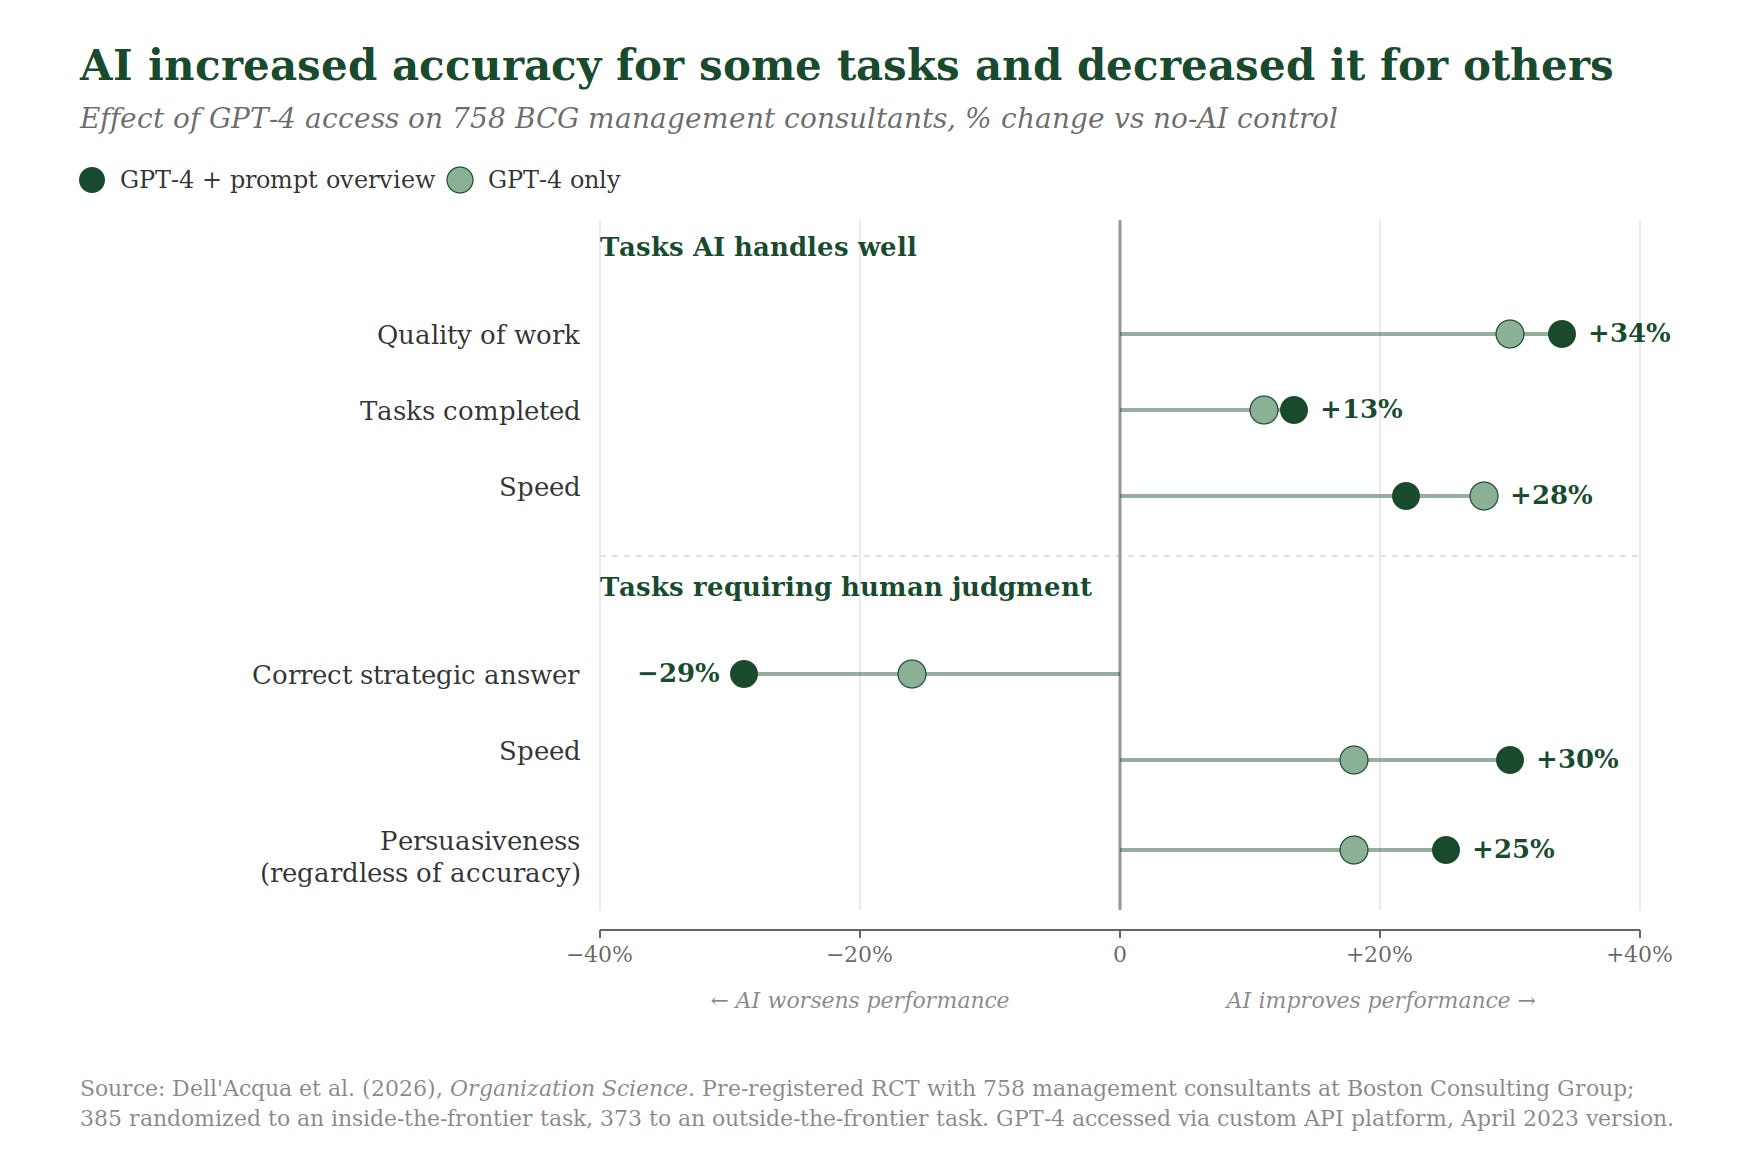
A BCG-Harvard “jagged frontier” study found that consultants using GPT-4 improved speed and quality on tasks inside the model’s capability frontier, but on a task outside the frontier, they were 19 percentage points less likely to produce correct solutions.
A much-discussed July 2025 METR study randomized sixteen experienced open-source developers to use or skip AI assistants on real tasks in their own codebases. AI increases productivity on many kinds of work, but the size and even direction of the effect depends heavily on the task and setting. In this study, developers expected AI to speed them up by 24% and came away believing it had sped them up by 20%. They were in fact 19% slower.
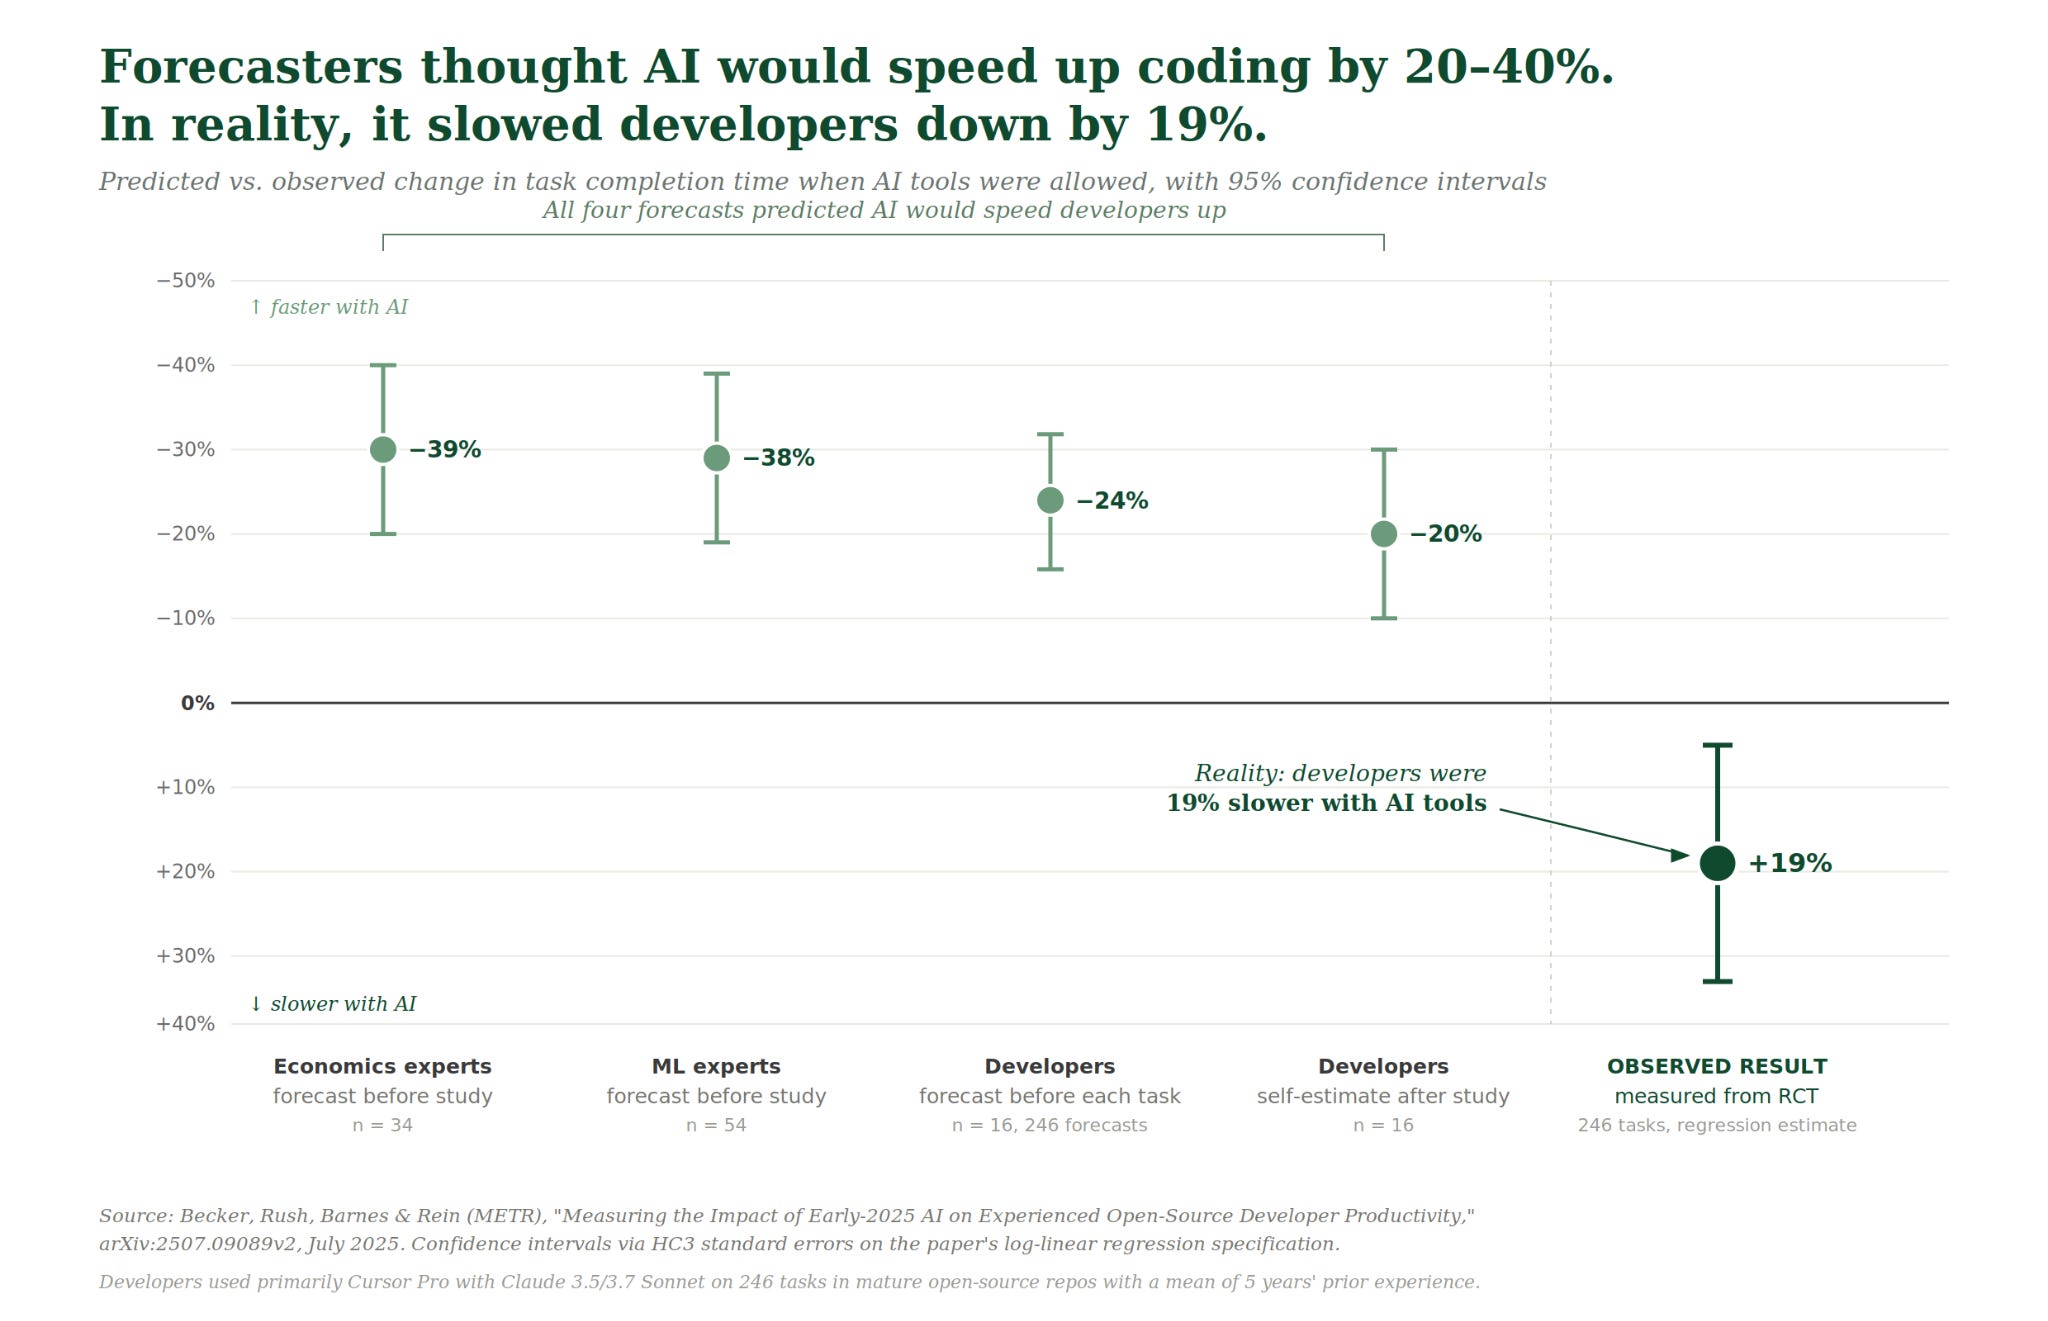
The gap between felt and measured productivity means we can’t necessarily assume productivity uplift from the revealed preference of using the tool. AI is differentially productive across tasks, and workers using it can’t always tell when it is. Usage data records the interaction regardless, and so blunts this differential. For the purpose of predicting labor market outcomes, these are very different dynamics.
Hiring or firing?
Even when Claude does productive work, usage data doesn’t help distinguish between opposing possible outcomes: reduction in hiring due to substitution (the worker no longer does the task) and an increase in hiring due to induced demand (there is more demand for the task as it becomes cheaper to complete, and the worker does more of the task with AI’s help).
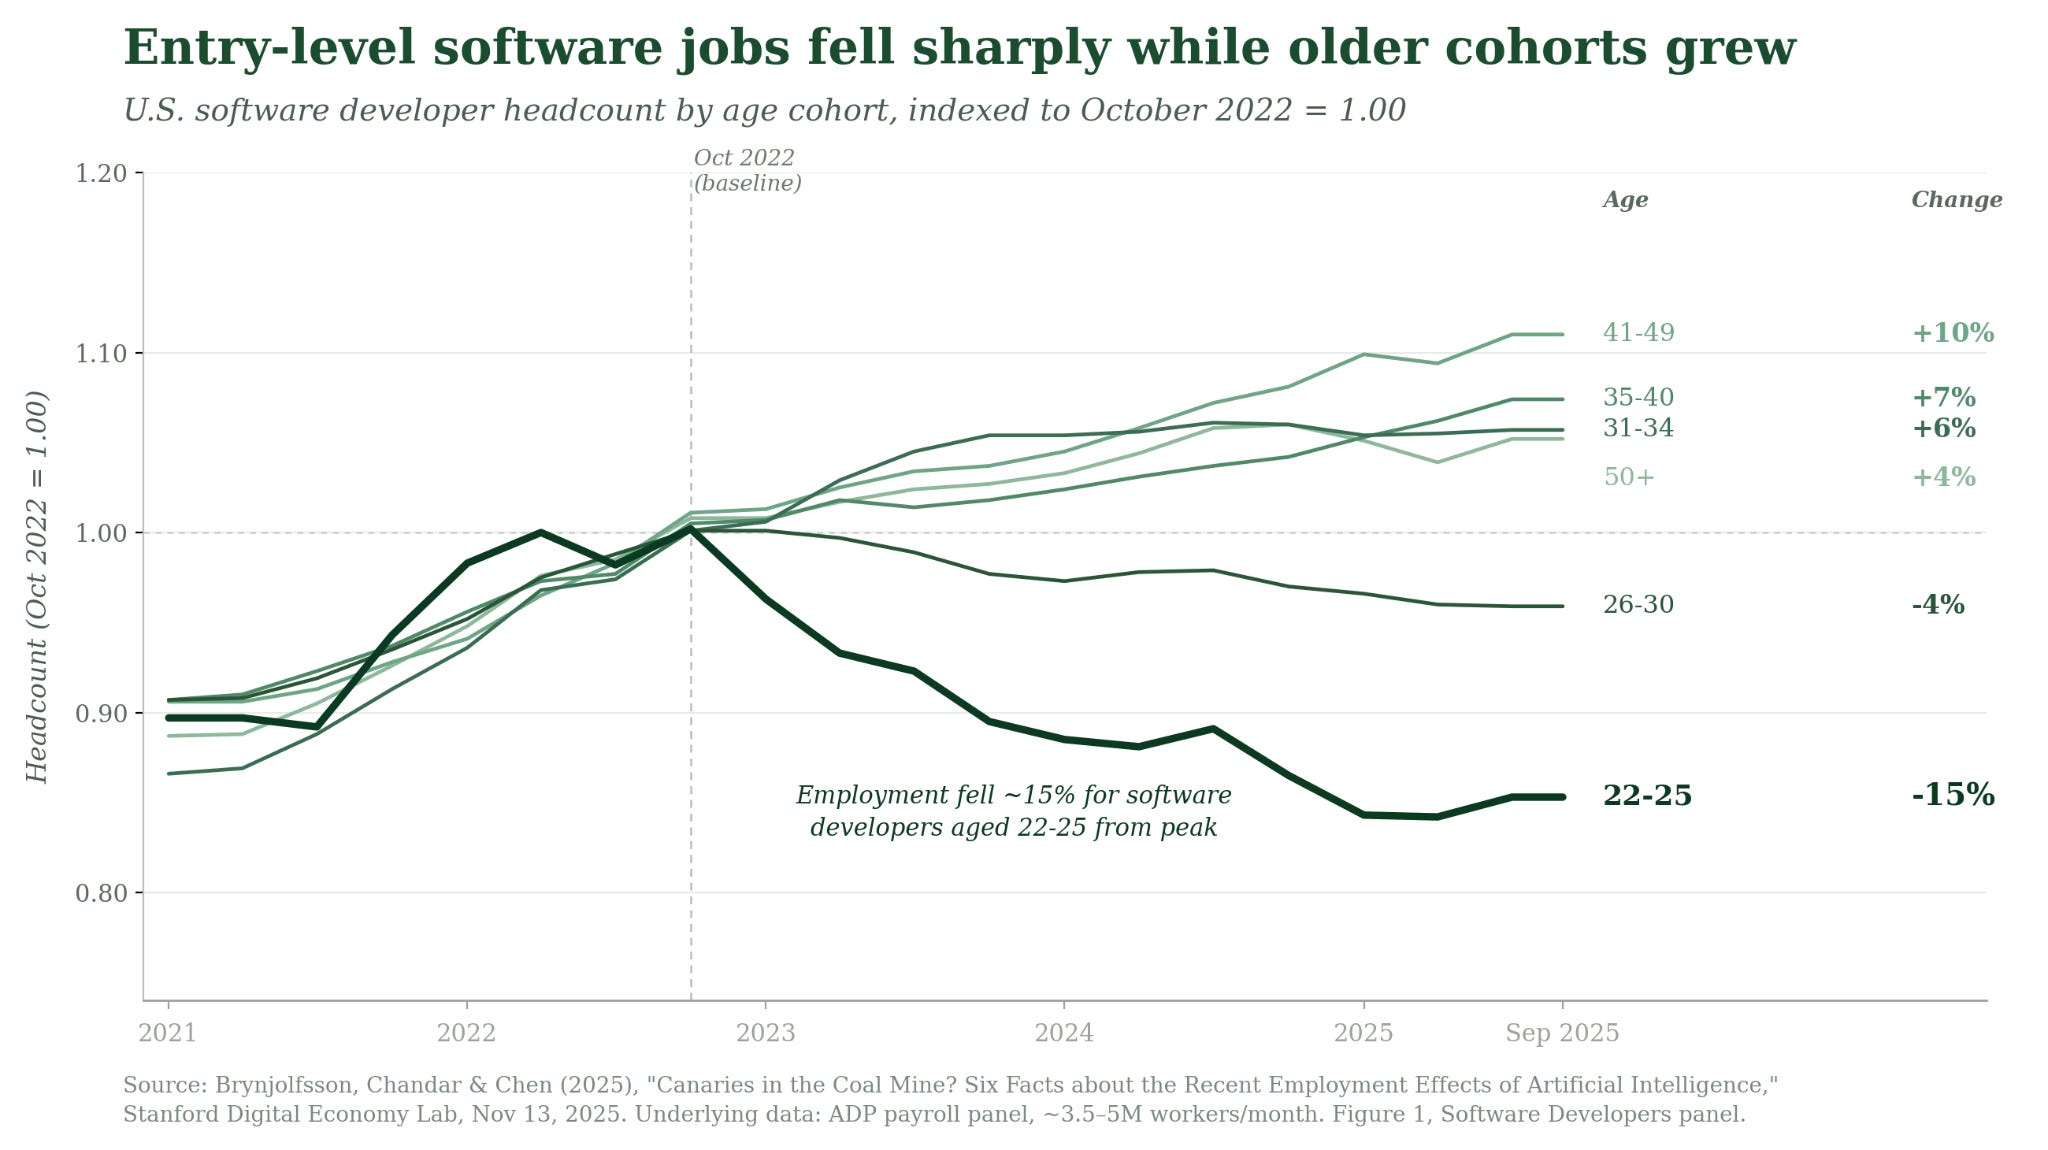
Anthropic CEO Dario Amodei predicted in March 2025 that AI would be writing 90% of code within six months, and separately that it may wipe out large swaths of tech jobs. The implication many drew was that mass software engineer layoffs were imminent. Today, AI is generating a lot of code, and total software engineering employment hasn’t collapsed.
Although entry-level postings are down year-over-year, mid-career employment has grown, and AI/ML engineer roles are up significantly. In this case, the same usage signal of Claude writing a lot of code has so far been consistent with substitution at one end of the experience curve, augmentation in the middle and higher experience levels, and induced demand for AI-adjacent coding — but significant humility is warranted when drawing a direct line from AI use to hiring and firing decisions.
The augmentation case can look indistinguishable from substitution at the API. When Brynjolfsson, Li, and Raymond studied customer service agents at a software firm, they found AI assistance increased productivity by 14% on average. But an identical usage signal could appear in a firm that absorbed productivity into handling more issues and one that fired half its agents. ATMs are the canonical case: by making branches cheaper to open, they increased teller employment rather than reducing it.
Anthropic’s measure attempts to address this by classifying each Claude conversation as either ‘automation’ (Claude doing the task) or ‘augmentation’ (Claude helping a human do the task), and weighting automated uses more heavily. But the distinction is inferred from interaction patterns in chat, like whether the user delegates, iterates on outputs, or asks for explanations, rather than from any observation of what happens to the work afterward. A conversation that looks ‘automated’ in the data may produce a draft the worker spends an hour rewriting.
There’s also a task-versus-job problem. Jobs are bundles of many tasks, so automating one might augment the job overall rather than threatening it. And as some tasks are automated, new ones get invented within the same role. Task-level usage data can’t see either dynamic.
Data without borders
Usage data also breaks down as soon as effects happen across borders. AI deployment is tied to the buyer of services, but the buyer isn’t necessarily the same as the worker the AI substitutes for.
For example, when a US firm replaces an Indian customer service contractor with a Claude API call, the usage signal appears in Anthropic’s data tagged to the US firm. The displaced workers are in Bengaluru or Manila, and U.S.-focused datasets used in this literature like the Current Population Survey, BLS occupational projections, and ADP payroll data would miss them.
Usage data can’t tell us where displacement will happen.
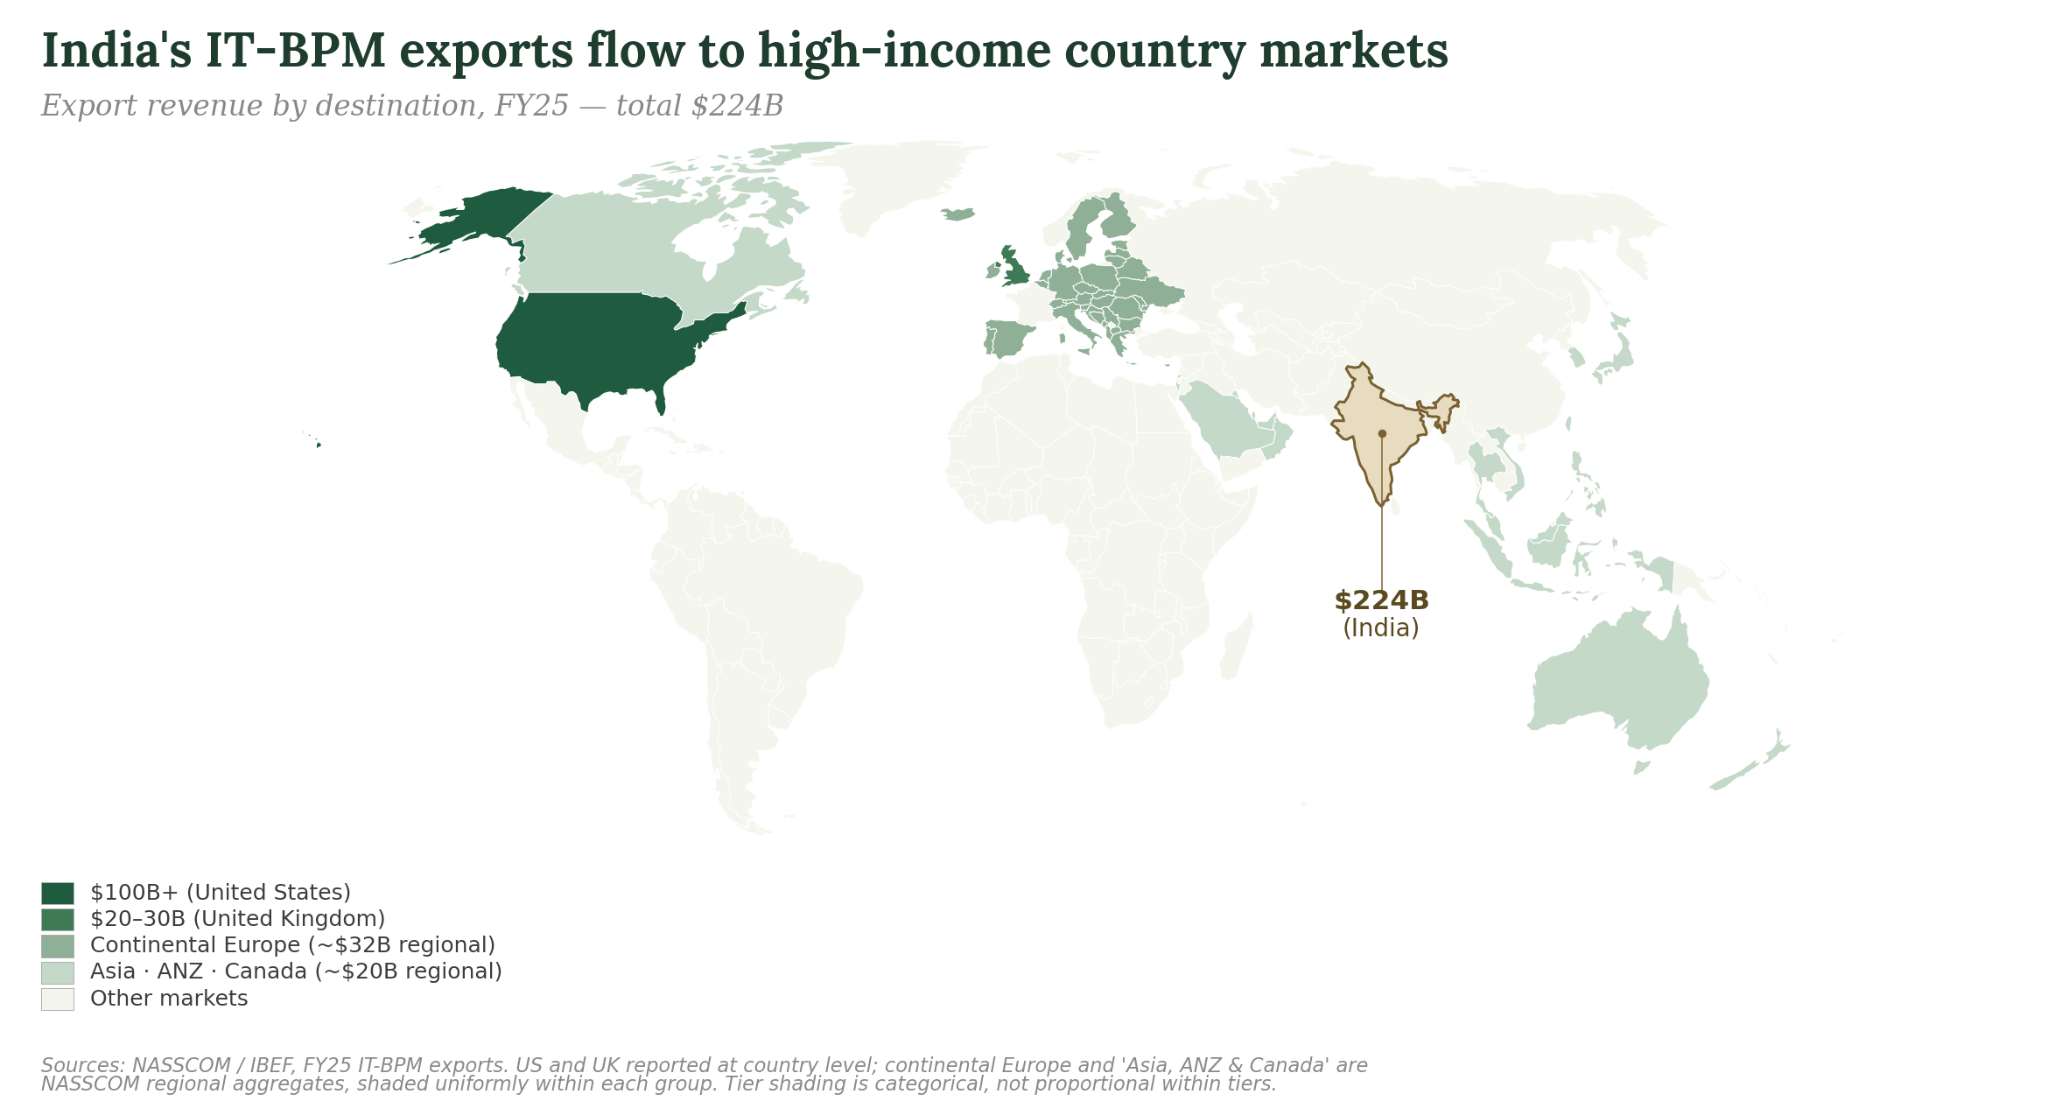
The scale of this issue is quite large. India’s IT-BPM sector employs 5.9 million people and exports $224 billion annually, mostly to the US. The Philippine BPO sector employs 1.8 million workers and generates $38 billion, which is 8% of GDP and the country’s second-largest source of foreign exchange after remittances.
At the February 2026 India AI Impact Summit, thirteen frontier AI companies signed the New Delhi Frontier AI Impact Commitments, pledging to publish AI adoption statistics “to lay the groundwork for evidence-based workforce and regulatory policy” by the next summit. Unless those statistics are linked to worker-side, supplier-country, or trade-flow data, they risk inheriting the blind spot built into the buyer-side usage data we’ve been describing; they may not detect cross-border displacement among LMIC workers whose tasks are highly exposed.
What Claude doesn’t see
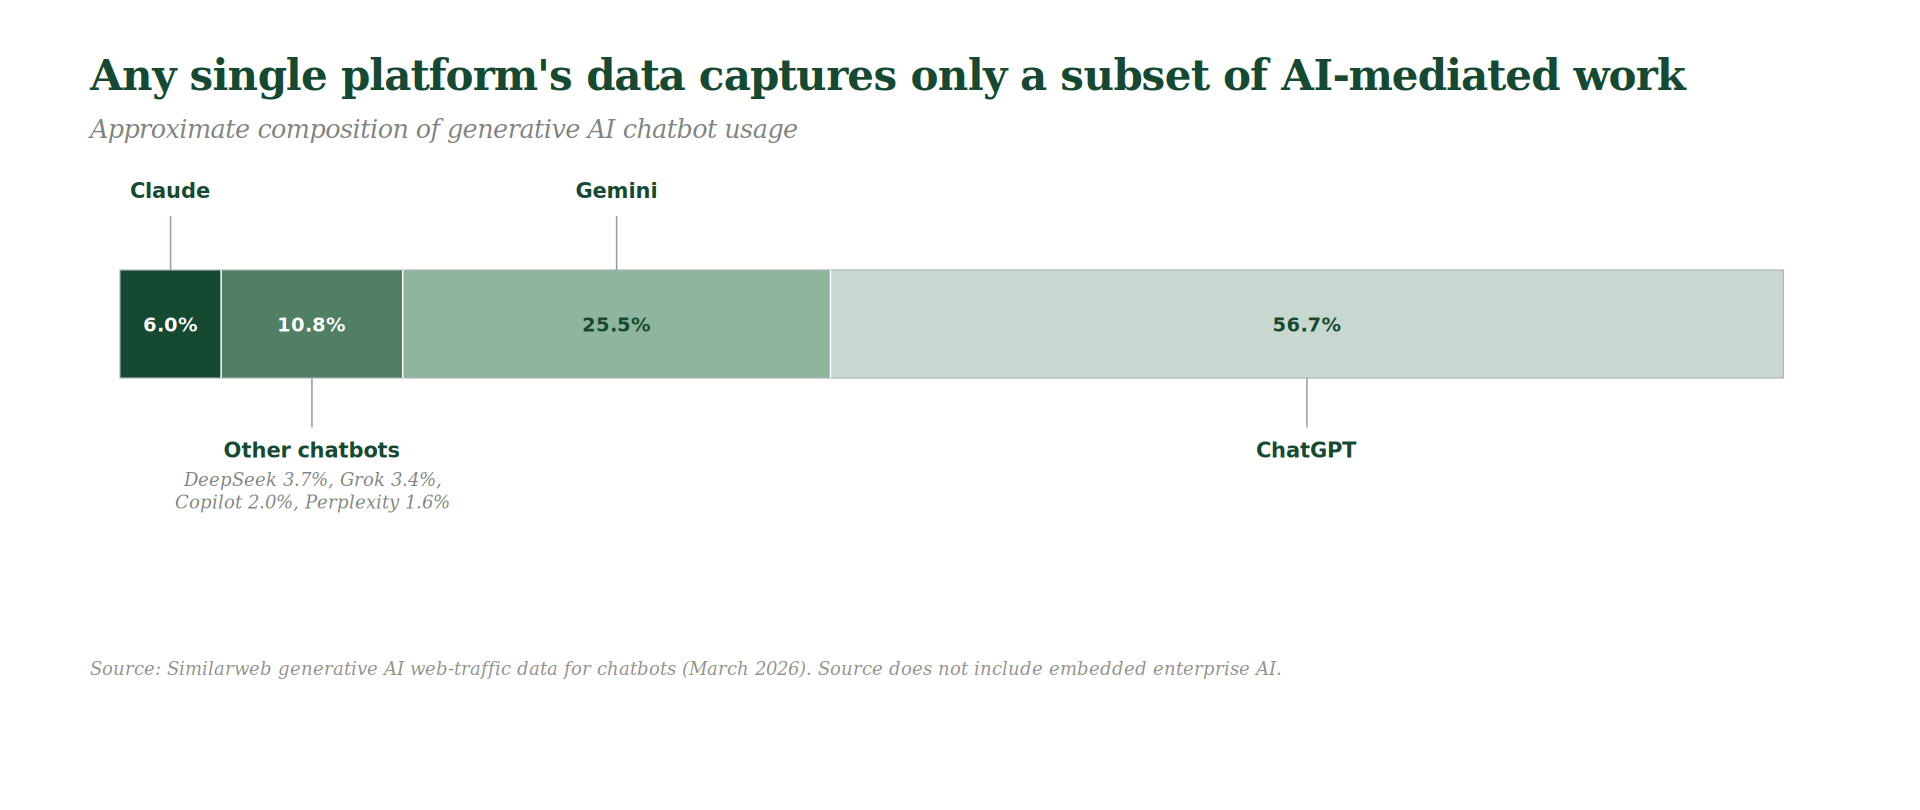
Any single platform sees only its own users. ChatGPT holds a majority of global chatbot traffic, with Claude, Gemini, Copilot, and others splitting the rest. Analysis through one platform only sees part of the overall usage, and it’s particularly hard to capture data from the AI features we now see embedded inside seemingly every piece of enterprise software like Microsoft 365 Copilot, Salesforce Einstein, or Adobe Firefly.
Among the Claude users Anthropic does see, the Anthropic Economic Index’s Learning Curves report notes that early adopters skew technical and high-skill. Users who tried Claude and stopped are not part of the data, and commercial or enterprise deployments may be governed by different retention and data-use terms. These are large firms with sensitive workloads, some of the most important users to inform substitution analysis, and they may be underrepresented. This composition issue matters for inference: the users most visible in usage data are not necessarily representative of the broader workforce.
What better measurement would look like
Let me first say that the Anthropic paper is a careful piece of work, and the labs publishing more data is a good thing. But the flaws in usage data are large, and the pattern of misinterpretation in policy and public discourse is consistent enough that this data may be actively harmful for getting the question right.
Mostly, we should be humble about what current data and indicators can tell us — which isn’t how they’re currently being used in policy and parts of academia.
There also isn’t really a great answer for predicting future labor market effects right now, and I won’t pretend there is. The reflex when a measure fails is to build a better measure, but that may not be the right approach in this case. Every generation of leading indicator since Frey-Osborne has gotten a bit closer to “real” data and still been treated as downstream evidence of displacement when it’s actually an upstream proxy several steps removed. This is because forecasting labor displacement from any upstream signal is very hard by nature.
But how can we do better?
Measuring how much AI actually enhances productivity is getting harder, not easier. When METR tried to re-run their 2025 RCT in early 2026, 30-50% of developers said they withheld some tasks from randomization because they did not want to do them without AI. METR has warned that these RCTs will keep getting more expensive, as workers require more compensation to complete tasks on the job without AI. However, there are still studies to be done at the firm level, especially in other professions where AI hasn’t saturated the workplace nearly as much as in coding.
Studies like Brynjolfsson, Li, and Raymond, 2023, which observe and track an individual firm closely, can help clarify whether AI may be substituting for, augmenting, or expanding human work for that setting. Similar research could be repeated across sectors and would produce more reliable signals, though they would be much more limited in scope than any aggregate index.
Usage data should also generally be treated as one signal among several and triangulated against trade flows, sectoral surveys, and job postings, and with explicit adjustments for the user-base skews.
One thing missing in the focus on aggregate indicators is a less satisfying but more useful approach: careful, occupation-specific work. Concretely, that means picking an occupation (paralegal, claims adjuster, customer service rep, middle school teacher…) and examining it closely in context. Break down the task mix and how much of the day each type takes, map current model capabilities against the specific tasks, talk to practitioners about what AI is actually good and bad at in their day-to-day work, figure out the edge cases AI is worst at, understand the regulatory environment, figure out the preferences and incentives of the people paying for the service, and so on.
Fifteen or twenty studies like this would tell you more about where AI is actually substituting for human work than an aggregate index. They wouldn’t provide a nice headline number, or a strictly comparable figure for decomposing individual jobs, but they would likely give a much clearer picture, occupation by occupation, of what is currently happening and what is most likely to happen under different capability trajectories.
interesting how AI companies are using usage of AI tools as a way to measure to measure job displacement but as you rightly mentioned that this analysis needs to dig at Work level. For eg: In the medical field , the clinicians are hoping to use efficiency gained through the AI tools to improve productivity instead of replacing clinicians which are overwhelmed with drudgery of repetitive data entry work or ability to diagnose better through different data points.
Really good analysis. I learned a lot. Thanks.